Putnam’s Demand Calibration Tool to increase demand estimate precision


Additional Authors: Rahul Ramesh, Chae Young Chang, Dhruv Doshi, Martha Gilchrist
Tool Development Contributors: Haotian Wu, James Robertson, Emily Mahland
Demand estimation studies executed via primary market research are and always have been a core capability of Putnam’s strategic advisory services. Each year, we conduct over 50 such studies in a variety of global markets and therapeutic areas. Putnam’s ultimate objective of a demand estimation study is to not only understand the impact that product, patient, and market variables will have on future product demand, but also to integrate estimates of demand into the broader product strategy that considers the current and future market context. As a result, it is critical that such estimates are as accurate and precise as possible. This article details some of the approaches Putnam uses to ensure high quality demand estimates, with particular focus on benchmarking to prior projects using our proprietary Demand Calibration Tool.
Challenges with translating market research outputs into demand estimates
Ideally, demand surveys would be perfect estimates of expected future demand. However, a variety of factors can prevent accurate, precise estimates of demand from primary market research, including but not limited to:
- Stakeholder over-enthusiasm for novel hypothetical products not yet available in the real-world
- Lack of stakeholder appreciation for real-world barriers (e.g., product logistics, access and level of challenge erected by payers, patient willingness to receive and/or pay associated out of pocket costs, etc.)
- Double-blinded nature of research removes potential halo effects (either positive or negative) from other indications or from the manufacturer reputation more broadly
As a result, calibration is often required. Calibration refers to an adjustment of the direct market research findings – in this context, the product’s estimated market share – to better reflect Putnam and client expectations of real-world demand. Calibration warrants consideration in many market research circumstances, commonly including:
- Small sample size
- Complex treater / referrer dynamics
- Testing of a pipeline product that has low physician familiarity
- Expectation of notable real-world barriers that could not be addressed in research
- Expectation of entrenched brand influence
- Expectation of entrenched manufacturer equity influence
Putnam commonly considers five calibration methods to ensure greater accuracy and precision in demand estimation (Figure 1). Some of these can be done during fielding (speeding up time to the result), while others are applied post hoc. They are also often used in combination, often to great effect. For instance, all of our web-based quantitative surveys include an element of real-time quality control, in addition to other calibration methodologies.
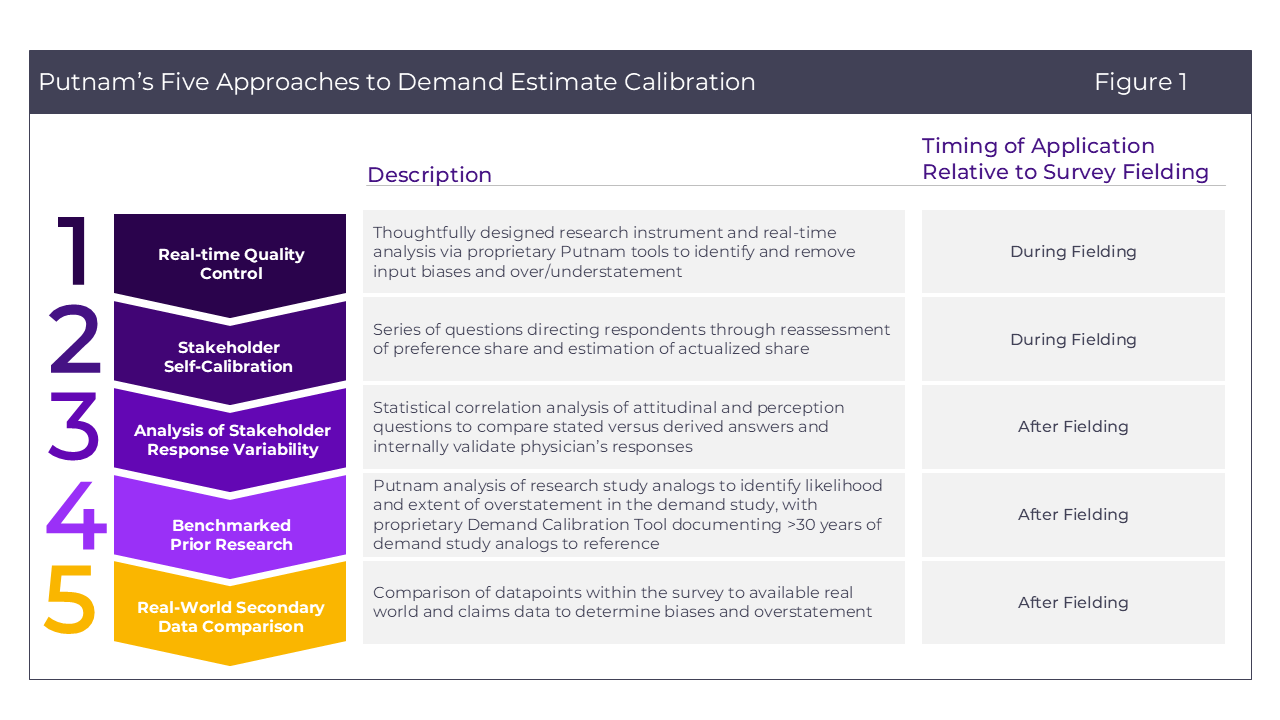
Of these methodologies, the true gold standard is secondary data comparison, in which primary market research’s estimates of product demand are compared directly to real-world data and then adjustments are applied to bring the market research in line with the real world. This approach can increase data accuracy, but also presents several notable limitations (Figure 2):
- Useful real-world data is typically difficult to identify and/or access. There are examples (for instance, Pfizer / Moderna / J&J share of COVID-19 vaccinations in the first few years of the COVID-19 pandemic in the US as reported by the CDC) but these are the exception and not the rule.
- The circumstances tested in market research (e.g., the market basket, product profile details, etc.) and those found in the real-world are typically not perfectly consistent.
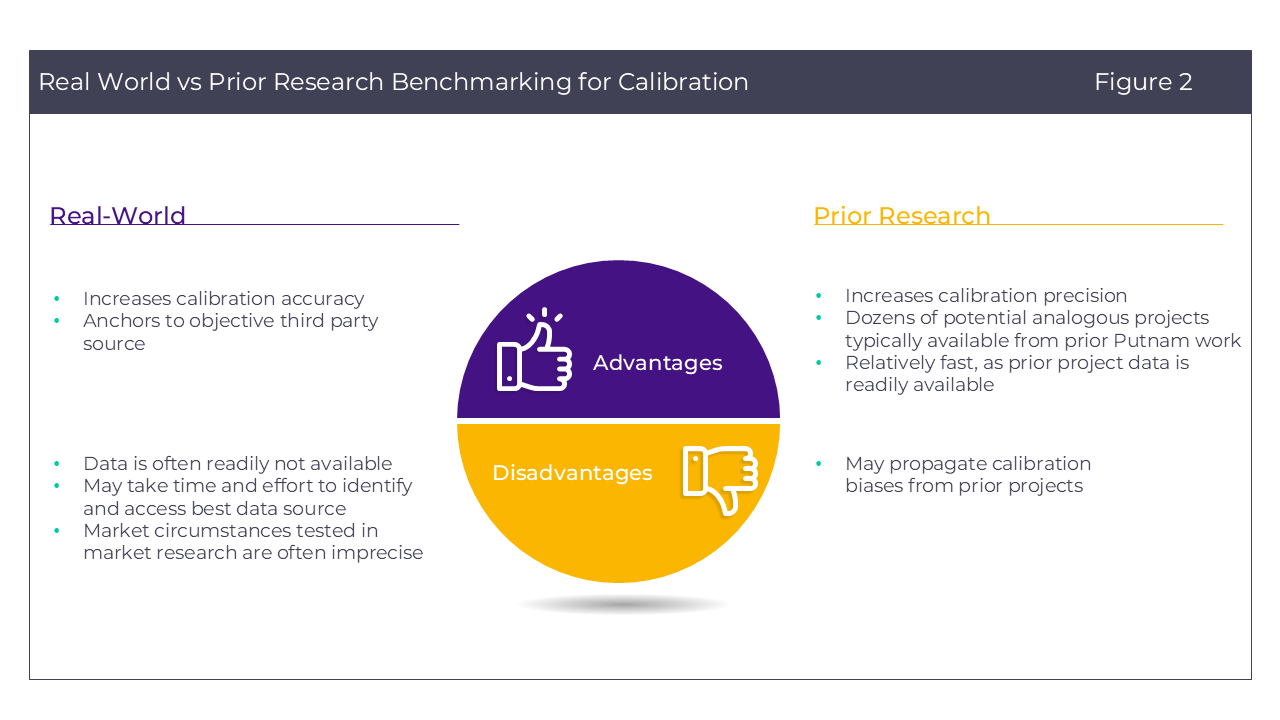
Given these limitations, an alternative method is to benchmark prior market research for analogous or semi-analogous market scenarios. With our long history of conducting demand studies, we have a robust set of prior studies in which we can survey past examples of market research demand estimates, identify the most analogous benchmark studies, and reference prior decision-making on calibration factors.
Putnam has created a tool underpinned by machine learning techniques to improve our ability to identify historical analogous projects to improve precision of calibration in demand studies
Demand estimation study experience
We have an extensive demand estimation study project library which was used along with advanced analytical techniques to uncover key trends and predictors of calibration.
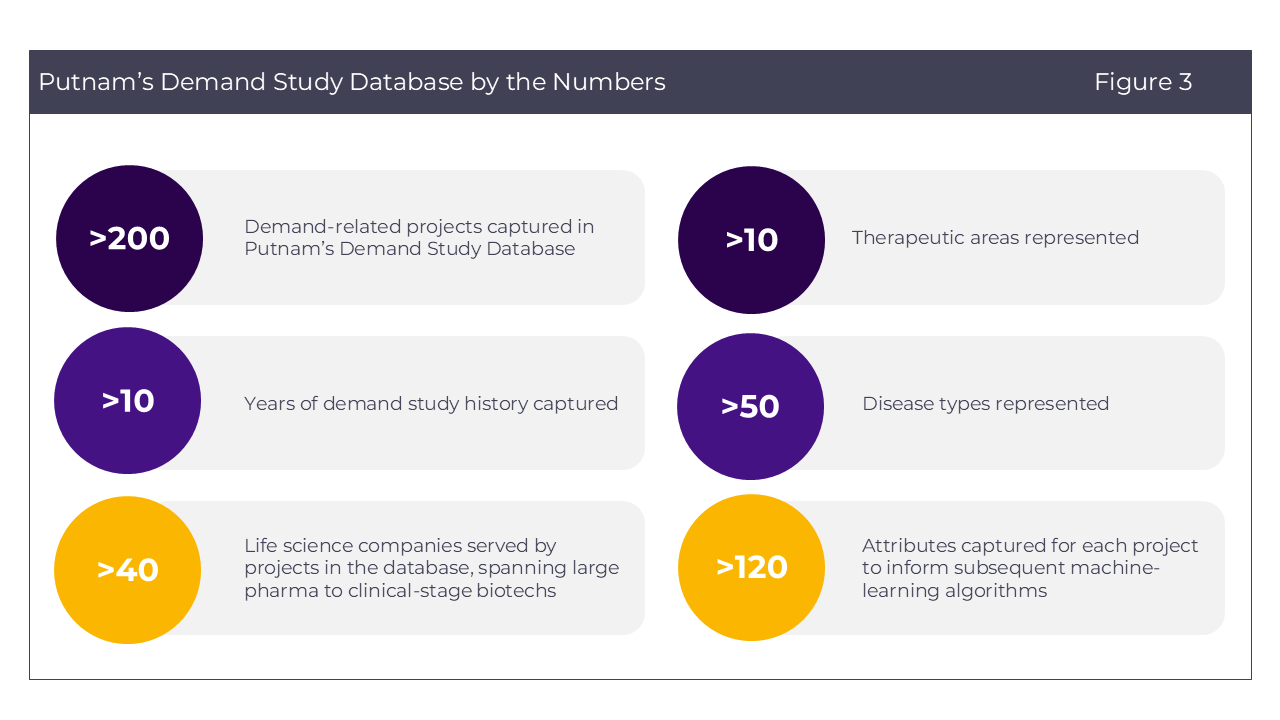
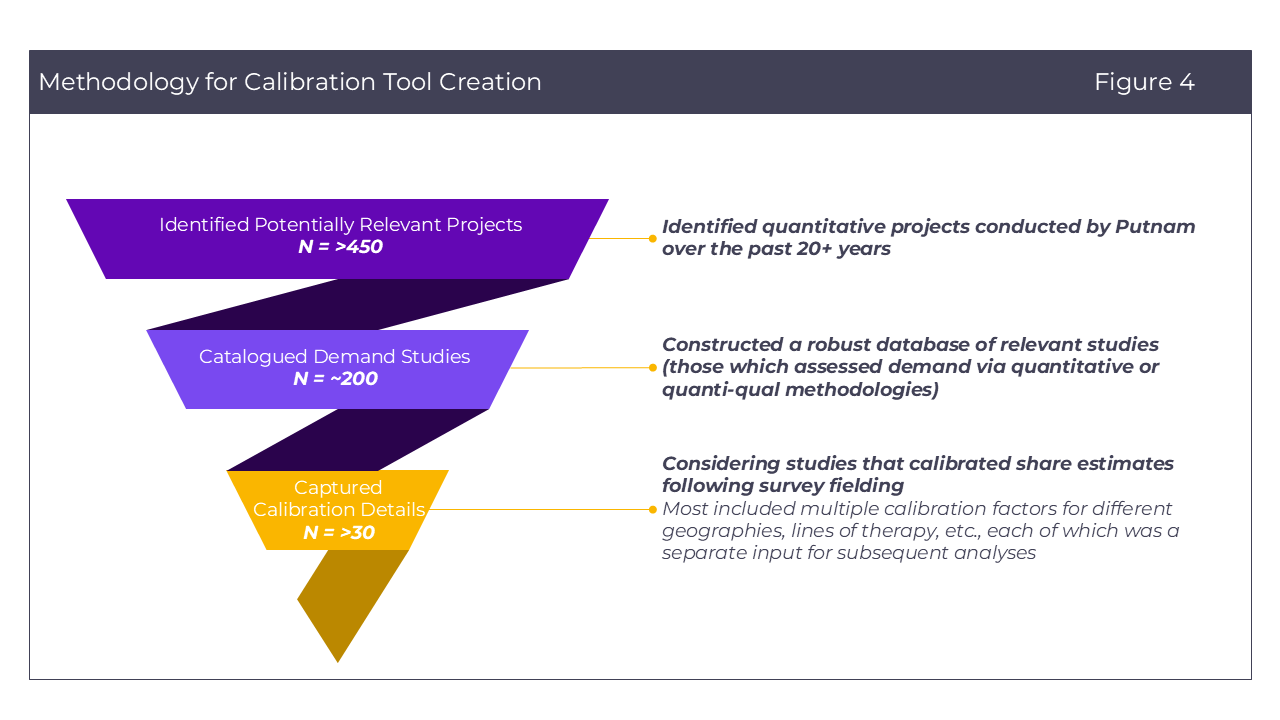
Putnam’s depth and range of demand estimation study experience results in a uniquely robust catalogue of past study data ripe with insights. We identified >450 potentially relevant projects and conducted a comprehensive review and cataloguing of this set to create our Demand Study Database. It includes over 200 unique demand-related studies conducted over 10+ years, representing our diverse work on these studies with 40+ life sciences companies across 10+ therapeutic areas and 50+ disease types (Figure 3).
We characterized each study according to 120+ attributes, including geographic scope, research methodology, product of study, disease landscape, manufacturer / client, and calibration decision & rationale, building out a large dataset of study-specific details (Figure 4).
This data was then used as inputs by Putnam’s Data & Analytics Practice, who conducted multiple statistical analyses on the database, ranging from machine learning tree-based modeling to a more common linear regression. An analytical approach was designed to answer the key question: what are the project attributes that are most predictive of the magnitude of calibration that was selected by the project team, and what range of calibration factors do they suggest?
Predictors of calibration
Attributes related to product characteristics and study methodology are top calibration factor predictors.
Our analysis uncovered eight key predictors of calibration, falling into two broad categories: product characteristics and study methodology details (Figure 5).
- Product characteristics: Descriptors of the key product for which demand is being estimated
- Study methodology: Market research design, including both geographies and approach to collecting demand estimates

The discovery of these top categorical predictors of calibration uncovered interesting and informative trends. Two of these include key product line of therapy and inclusion of patient chart exercises to estimate demand.
Larger calibration factors
Therapies being developed and assessed for later lines of therapy typically require larger calibration factors.
The first trend of interest is that therapies for which demand is being assessed in later lines of therapy typically require more aggressive calibration adjustments vs those being assessed in earlier lines of therapy. On average, demand for therapies being assessed in the first line (1L) setting required a relative share calibration factor of -25% +/- 4% (95% CI), while those being assessed in the fourth line (4L) required significantly larger calibration factors of -45% +/- 7% (95% CI) (Figure 6).
We hypothesize that asking physicians to consider the first therapy administered to a patient post-diagnosis is more likely to be clear, whereas in later lines, additional conflating factors may create additional uncertainly for physicians. These factors may include but are not limited to:
- Types of prior therapies received by a patient (target, modality)
- Prior therapy response
- Disease progression and changes in fitness / performance status
- Small patient population sizes treated by an individual physician, increasing recency bias
- Greater number of therapies indicated for later lines (particularly in oncology)
As a result, it may be more appropriate to consider larger calibration adjustments to market research demand estimates for therapies being assessed in later lines versus earlier lines.

Inclusion of patient chart exercises to increase calibration precision
Patient chart exercises require a physician respondent to actively reference and input information for a specific recent patient, rather than thinking about their patient population in aggregate. We found that (when two outliers were excluded, Figure 7):
- Use of patient chart exercises resulted in roughly the same calibration factor as demand studies that did not use patient chart exercises (-31% vs -29%, respectively).
- However, those with a chart exercise notably narrowed the range of calibration factors across historical projects, with only a ~5% range with patient chart studies once two outliners are included vs a range of almost 70% in studies without patient charts.
We hypothesize that this forced thinking about individual patients in a chart exercise results in more consistent physician responses in terms of over-enthusiasm and other variables influencing demand accuracy. As a result, if patient chart exercises are included in a demand study, it may result in greater confidence in the calibration factor applied to account for these variables.

Overall, these two highlighted trends and others uncovered in the analysis validate well-known behaviors influencing market research accuracy, which are very difficult to fully eliminate despite sound survey design and careful planning. These findings emphasize the need to strategically determine calibration adjustments to demand estimation studies based on the study’s key attributes.
What can the tool do?
Putnam has created the Demand Calibration Tool as a platform to leverage our wealth of historical demand data to enable rapid identification of an appropriate range of calibration factors.
For demand studies that are deemed to require calibration, Putnam’s proprietary Demand Calibration Tool is used to improve calibration factor precision, enhancing confidence in the resulting demand estimate.
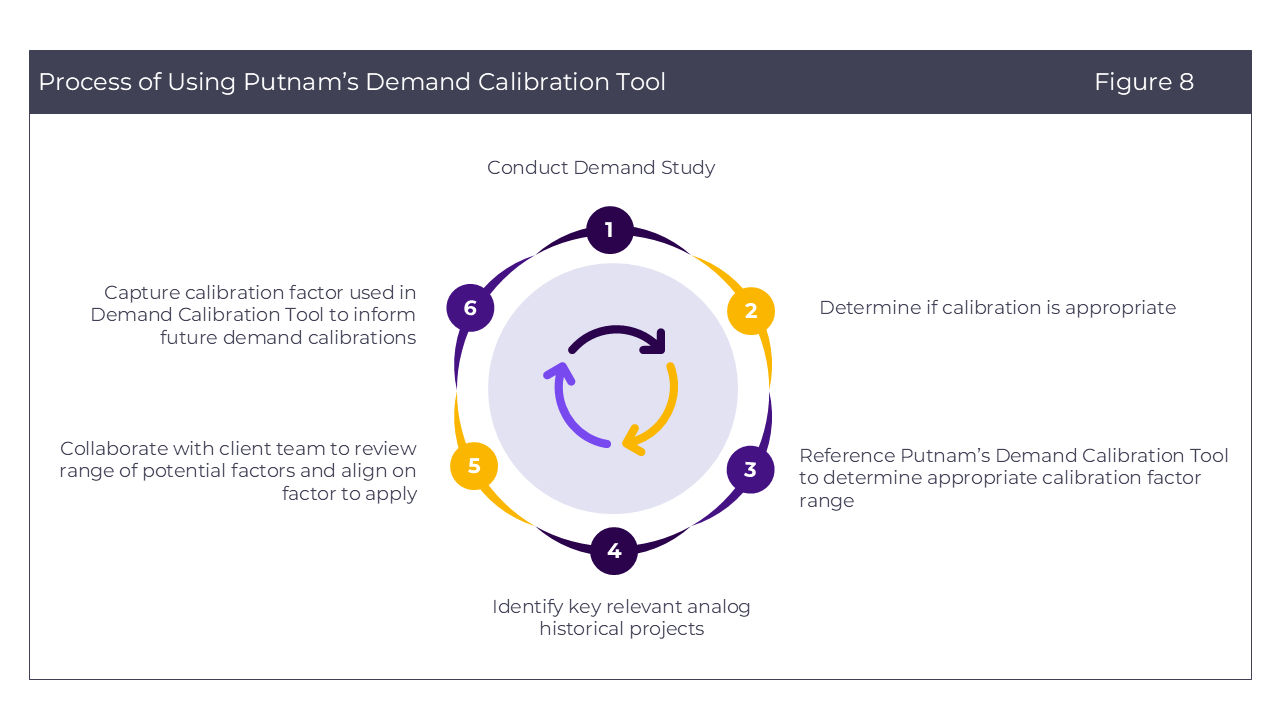
How it works (Figure 8):
- Conduct Demand Study: Thoughtfully design demand study to minimize or eliminate need for calibration.
- Determine Calibration Need: Following fielding, determine if post-fielding calibration is needed, based on potential risk of imprecise / inaccurate outputs as a result of study or product parameters.
- Calibration Range Determination: Factors that are deemed likely predictive (either the top eight identified by machine learning algorithms, figure 5, or those custom selected by the Putnam project team) can be used to identify a range of calibration factors used in relevant analog projects with similar product characteristics or study methodologies.
- Analog Project Identification: Discrete key analog projects with a high degree of similarity to the project in question can also be identified, with key project and product characteristics shared with client teams in a blinded fashion.
- Collaborative Putnam / Client Team Discussions and Calibration Factor Alignment: These data are typically inputs for detailed discussions between Putnam & client teams to collaboratively align on a calibration factor that is fit-for-purpose and uniquely appropriate for the market research study at hand.
- Demand Calibration Tool Upgrading: This resulting calibration factor will be incorporated into the tool and improve its trend-based recommendations as more experience and data are added, further improving the tool’s utility to inform Putnam recommendations & client decision-making over time.
We use this tool, coupled with in-depth strategic thinking and deep knowledge of specific disease spaces and markets, to collaboratively align on the right demand estimates for forecasting. We integrate insights into the broader context to ensure these demand estimates are not only precise and accurate but also tie to a specific strategic vision for our clients’ products that can be communicate both internally and externally.
Putnam’s proprietary Demand Calibration Tool, along with the volume & diversity of Putnam’s demand estimation work over its 30+ years of experience positions Putnam as a clear choice for life sciences demand estimation research that goes beyond market research insights to deepen understanding of demand and how to maximize. Putnam regularly conducts demand studies across stakeholder types (physicians, patients), therapeutic areas (oncology, cardiovascular, etc.), and global markets. Putnam’s consistent role & value-add is contextualizing & questioning vs. simply delivering data derived from market research, keeping strategy and critical thinking at the core of all engagements. Please reach out if you would like to estimate your product demand with Putnam.

Jump to a slide with the slide dots.
ESMO 2025 Insights: Emerging oncology trends highlighting the need for Precision Medical Affairs
At ESMO 2025, science set the pace, but Precision Medical Affairs defined the path, turning complexity into clarity and innovation into impact.
Read moreGetting Ahead of EU HTA: How our predictive PICO Simulator Capabilities Support Smarter Market Access
Predictive insight meets human intelligence, reshaping EU HTA readiness through smarter, data-driven evidence planning.
Read moreValue of Equity in HTA: Current Guidelines and What to Expect
Equity in HTA is evolving. Explore current guidelines, future trends, and how Putnam advances equity methods in health assessments.
Read more